Posted: 5th May 2025
Time to read: 2mins
Example: Acromegaly (Adults and Children)
Editorial Guidelines: i) To ensure optimal visual resolution, it is advisable to permit the video to fully buffer; ii) this calculator is not intended for predicting sexually transmitted infections (STIs or STDs) or heritable genetic diseases diagnosed at birth; iii) applicability is determined by the specific country or continent.
In this example, a re-evaluation of the prevalence rate was conducted based on said-reliable information from medical claims data. However, such credible data may not sufficiently substantiate the accuracy and precision of the information in relation to real-world scenarios. Diseases that present with mild symptoms are often disregarded. This consequently cause a delay for patients to acknowledge the necessity for medical consultation and to receive appropriate treatment. The Keras360 disease rates calculator is designed to provide precise prevalence rates that accurately reflect real-world conditions.
How accurate is the calculator?
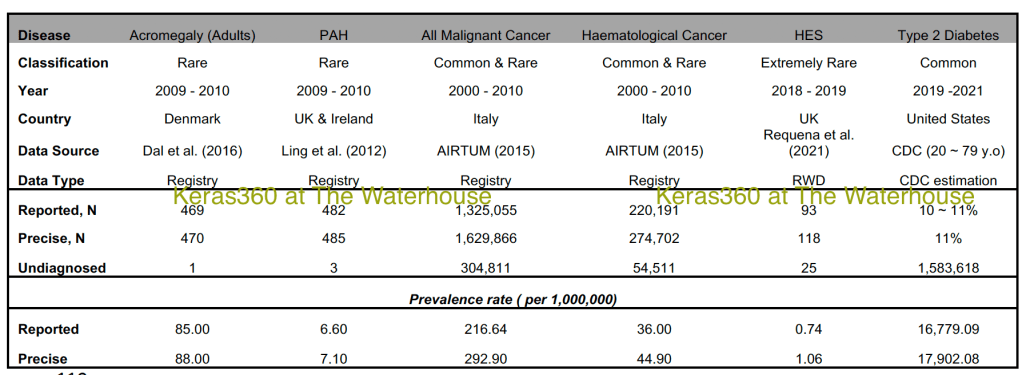
According to research conducted at Keras360 in January 2024, it can be asserted that the estimates generated by the calculator are more precise than those derived from conventional calculations for prevalence rates. The accompanying Table 1 illustrates this finding, as depicted in the featured image ( desktop page view; on the right). When a national disease registry is accessible and the diagnosis of a rare disease is firmly established, it enables the evaluation of the protocol estimation’s accuracy. It is important to note that most diseases necessitate time to manifest, and high-risk individuals may frequently remain undiagnosed until symptoms arise. This reasoning further elucidates why estimates for common chronic diseases tend to be underestimated when applying traditional methodologies. The undiagnosed category may effectively represent high-risk individuals who may have experienced little or no symptoms.
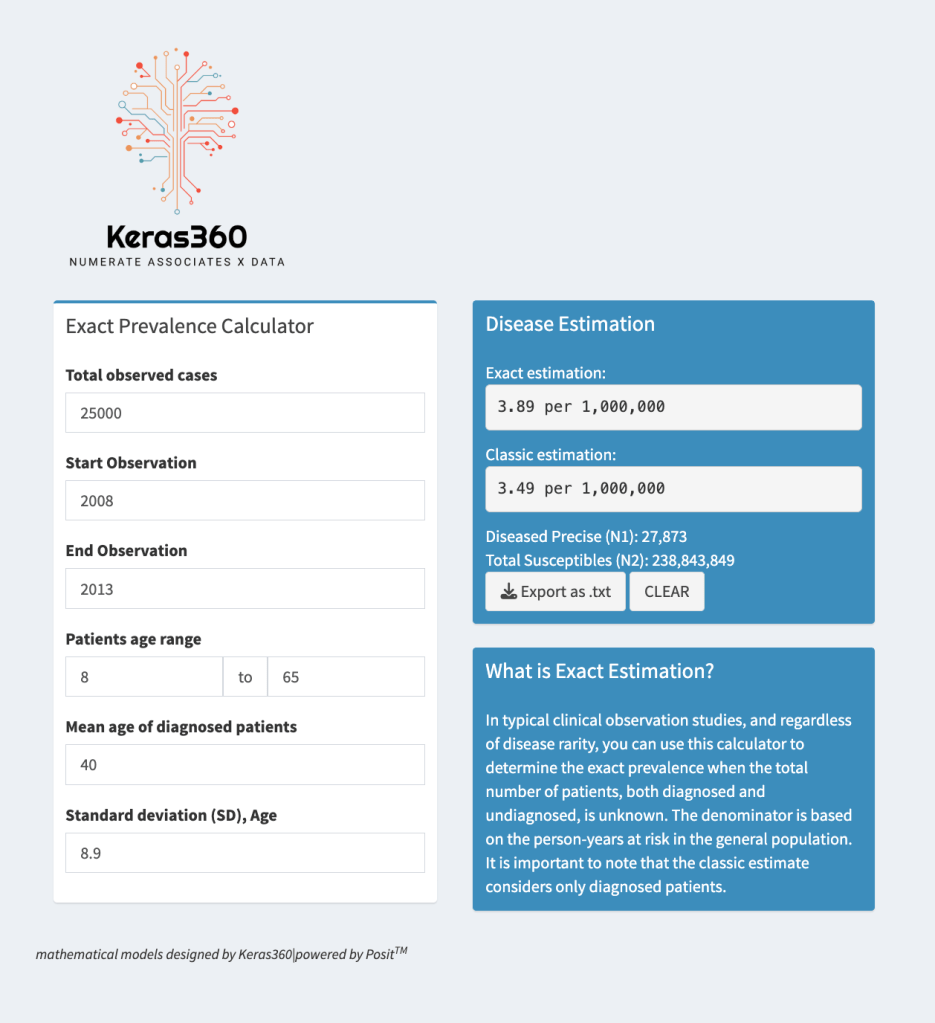
Table 1. Estimated precise total diagnosed and undiagnosed patients for common and rare diseases.
The exact estimation aka. precise estimates derived from Keras360 computations are anticipated to be greater, as they include both diagnosed and undiagnosed cases; refer to Precise, N . Point prevalence rates pertain to the specified calendar year range and are expressed in per 1,000,000. Abbreviations: Real World Data (RWE, Primary Care Data); Centers for Disease Prevention and Control (CDC); Pulmonary Arterial Hypertension (PAH); Hyper-eosinophilic Syndrome (HES). ♤
FAQ
Q&As shown below were updated on 20th August 2025.
Tap on each FAQ to learn more.
Q1: In the context of constructing this calculator, is it necessary for Keras360 to have access to individual medical records, specifically the records of individual patients?
For this particular calculator, Keras360 does not necessitate access to medical records. However, in the semi-automated setting, users are required to input fundamental demographic information pertaining to diagnosed patients, such as mean or median age, affected age range, and the total number of patients over specified observation years.
Q2 : My country maintains a population registry; however, it does not enforce stringent regulations requiring the registration of all newborns within the national database. Additionally, not all individuals, including adults, possess an identification card. Occasionally, certain individuals may be regarded as nomads, residing temporarily in a particular location for a limited duration. The sole reliable data available to me consists of the patient records from the hospital where I am employed.
This inquiry comprises two components, both of which pertain to the same theme – the denominator: i) individuals who are unaccounted for but are alive and may necessitate medical intervention and preventative measures, and ii) the tracking and tracing of individuals lacking a permanent residence, and possibly not possessing identification cards or birth certificates. At Keras360 at The Waterhouse, we possess the requisite analytical expertise to refine the parameters assigned to the denominator within the equation (refer to the video, step 2). It is imperative to reiterate that analyses concerning infectious diseases employ a distinct analytical framework; the COVID-19 demonstration serves as a pertinent example. Demonstrations concerning STDs/STIs are also available upon request.
Depending on the hypothesis and objectives of the project, the application of a separate technology may be advantageous for the track-and-trace process.
Q3: May I utilize this calculator to acquire dependable estimates pertaining to infectious diseases?
The design of this calculator does not incorporate the concept of contact rates among individual members in the population, which is a critical component for the persistence and dissemination of infectious dynamics within a population. For further insights into the utility of an alternate blueprint, you may refer to the COVID-19 demonstration.
Other relevant pages:
