Simplest, yet the most crucial fundamental calculation
Disease rates hold significant importance for healthcare providers and insurance companies. The primary numerical indicators in epidemiology are the incidence and prevalence of disease rates, which are essential for corporate management, including the determination of insurance premiums, allocation of resources for research and development of generic and biosimilar drugs, and the dynamics of drug pricing and acquisitions. Although it may appear straightforward, it delineates the fundamental components necessary for establishing a reliable healthcare system and medical coverage.
Most epidemiologists and public health analysts concur that the numbers derived from the traditional formula often serve as under-estimated reference figures. A recent video illustrates the calculation of prostate cancer rates in East Asia and the methodology behind the estimates. Patients may present early symptoms a decade before clinical diagnosis, and the progression of the disease is generally slow in most cases, resulting in a low diagnosis rate juxtaposed with a high prevalence.
A brief introduction of the two important numeric figures.
- Incidence describes NEW occurring cases in the specified year.
When rate is concern, you will need to obtain the frequency.
Incidence rate (β) = New cases (n) / person-years in the population at risk (Lx)
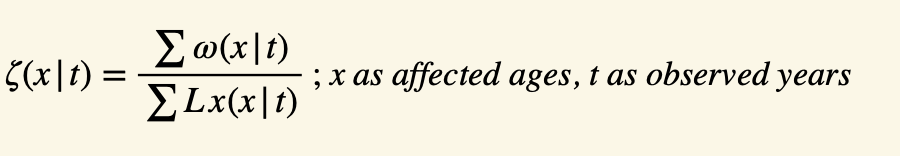
- Prevalence describes the TOTAL number of cases in specified year or calendar time-duration; t . According to the classical equation, the prevalence rate ζ(t) is defined as the proportion of diagnosed cases within the total population at the designated calendar time. Most often, point prevalence is the preferred terminology in epidemiological context.
In the classic context:
Prevalence rate (ζ(t)) = All cases N(t) / Total population of interest Nk(t)
In healthcare and biopharma industries, incidence and prevalence rates are the building blocks in supply and demand.
Challenges in Estimating Disease Prevalence
Estimating disease prevalence poses significant challenges due to the need for accurate disease progression and awareness, which both require considerable time. While it is commonly assumed that hospitals and clinics maintain the most current records of diagnosed patients, it is important to acknowledge that patients often experience delays in receiving a diagnosis. In the case of rare diseases, limited knowledge hinders the prompt and accurate diagnosis of patients, leading to delays in receiving appropriate treatment. Additionally, certain diseases exhibit high selectivity based on age and gender, further complicating the estimation process by necessitating information pertaining to at-risk population segments.
Determining Importance: Prevalence vs. Incidence Rate
The significance of prevalence versus incidence rate hinges on the context in question. Analysis of infectious diseases often benefits from a focus on the prevalence rate, while genetic diseases are typically evaluated based on the incidence rate. Nevertheless, certain stakeholders, such as healthcare providers and payers, may find it necessary to monitor both rates concurrently.
Determining undiagnosed patients or high-risk individuals
With the assistance of empirical electronic medical records (EMR), it is highly conceivable to identify the characteristics of undiagnosed patients and to re-outline disease diagnosis criteria. However, this process can be computationally intensive, and the sample size must meet certain requirements to achieve reliable estimations. In other words, retrieving estimations for rare diseases may be limited.
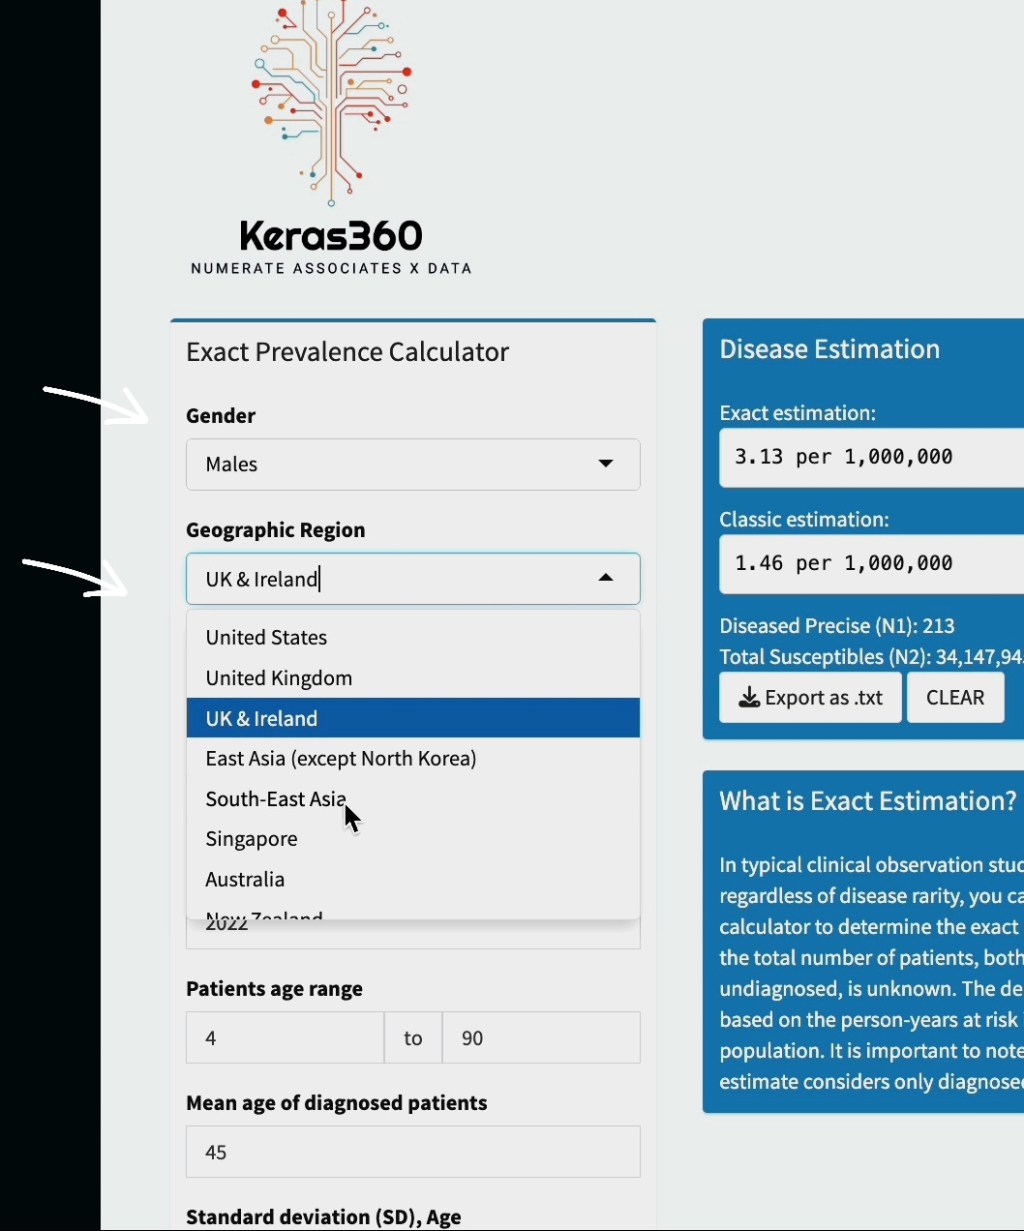
In 2023, Keras360 developed a new protocol for re-evaluating disease rates . This method relies on the population at-risk and the demographic characteristics of the patients. To obtain an accurate estimate of the prevalence rate, certain prerequisites need to be met. These include basic descriptive statistics such as mean and standard deviation of the patients’ age, and for further optimisation of precision, the minimum and maximum age range of the observed patients would be beneficial.
New protocol comprises patients’ characteristics 𝝎 and respective person-years at risk, Lx:
The new precise estimation is not limited to specific types of cancer diseases and has demonstrated exceptional reliability when compared to registry data for genetic diseases. Additionally, it aids in detecting sudden, disease-specific increases. Refer to : Guide 101
What about neonatal genetic diseases? Can it be determined using the same approach?
The incidence of genetic diseases manifesting in infancy or in newborns is typically calculated using Bayes’ theorem and the Hardy-Weinberg Equilibrium, which do considers silent carriers. This involves assessing the probability of an affected offspring based on parental genetics and the occurrence of marriage or romantic partnership. While sporadic cases may arise, the likelihood is minimal, typically falling below 1% to 5%. Conversely, adult-onset diseases present greater complexity in clinical diagnosis, often necessitating an extended observational period to observe the manifestation of symptoms.
A short summary of the new tool or methodology
The accurate estimation of disease prevalence rates is crucial for public health initiatives, healthcare stakeholders, and resource allocation. Understanding the prevalence of a disease in a population allows healthcare providers and policymakers to make informed decisions about intervention strategies, allocation of resources, and public health education. By including both diagnosed and undiagnosed cases, the new protocol provides a more comprehensive understanding of the burden of a specific disease, shedding light on potential areas for targeted interventions and screening programs.
Furthermore, the demonstration of an app-based calculator showcases the potential for technology to aid in epidemiological research and public health practice. With the widespread use of smartphones and digital tools, the integration of an app-based calculator can facilitate real-time data collection and analysis, enabling timely responses to sudden increases in disease prevalence. This innovative approach not only enhances the accuracy of prevalence estimation but also demonstrates the adaptability of digital solutions in the field of epidemiology.
In summary, the blueprint developed by Keras360 for the re-estimation of prevalence rates delineates a multifaceted methodology for accurately estimating and comprehending disease prevalence. It underscores the significance of thorough data collection and the application of innovative tools in the domain of public health research and management. This semi-automated framework provides pertinent insights for healthcare providers, researchers, and policymakers, thereby facilitating informed strategic decision-making within the fields of public health and epidemiology.
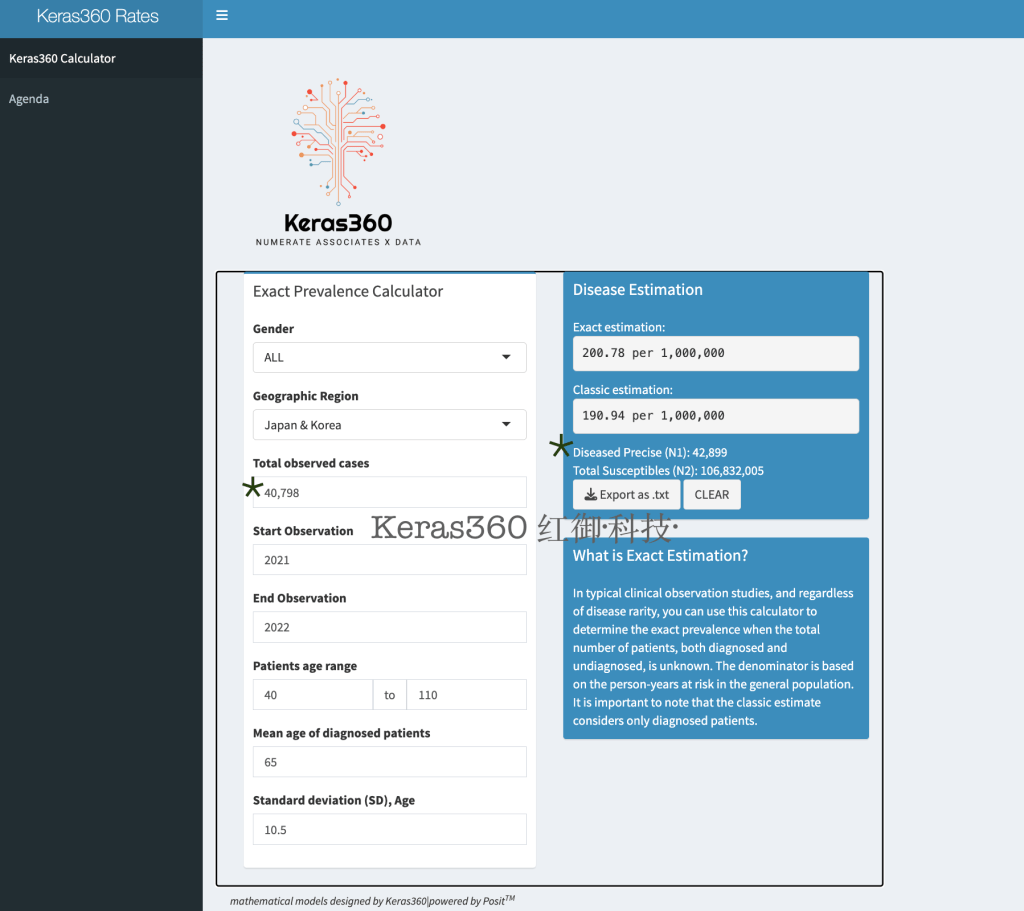
N.B. Numeric figures denoted by asterisks hold significant importance within the sales and marketing department.
Other relevant pages:
Guide 101 : https://keras360.io/calculators-and-ui/calculator_guide/
Demo Calculator : https://keras360.io/calculators-and-ui/
Video credits
Cancer Insights: Prostate Cancer in East Asia
Tagline: To do, and not to do
Made by Keras360, The Waterhouse SG
Music by Tony Ann
Download PDF version:
External Links
Zhu, Y., Freedland, S.J. & Ye, D. Prostate Cancer and Prostatic Diseases Best of Asia, 2019: challenges and opportunities. Prostate Cancer Prostatic Dis 23, 197–198 (2020). https://doi.org/10.1038/s41391-019-0193-7
IARC
Zhu, Yao1,2,; Wang, Hong-Kai1,2,; Qu, Yuan-Yuan1,2; Ye, Ding-Wei1,2,. Prostate cancer in East Asia: evolving trend over the last decade. Asian Journal of Andrology 17(1):p 48-57, Jan–Feb 2015. | DOI: 10.4103/1008-682X.132780
Ko LC, Gravina N, Berghausen J, Abdo J. Rising Trends in Prostate Cancer Among Asian Men: Global Concerns and Diagnostic Solutions. Cancers (Basel). 2025 Mar 17;17(6):1013. doi: 10.3390/cancers17061013.